
The concept we rolled around was music - specifically we were interested in using the Spotify API.While time constraints were an issue in building our own database direclty from the Spotify API itself, Google led us to kaggle and datasets drawn directly using the Spotify API.
We identified a dataset that contained CSV files of track data and artist information. There were a couple of fields that piqued our interest - followers and popularity ratings, which led us to investigate that from the available datasets.

CSV files derived from Spotify API by external data scientists and extracted from kagglev and Recording Industry Industry Association of America (RIAA)
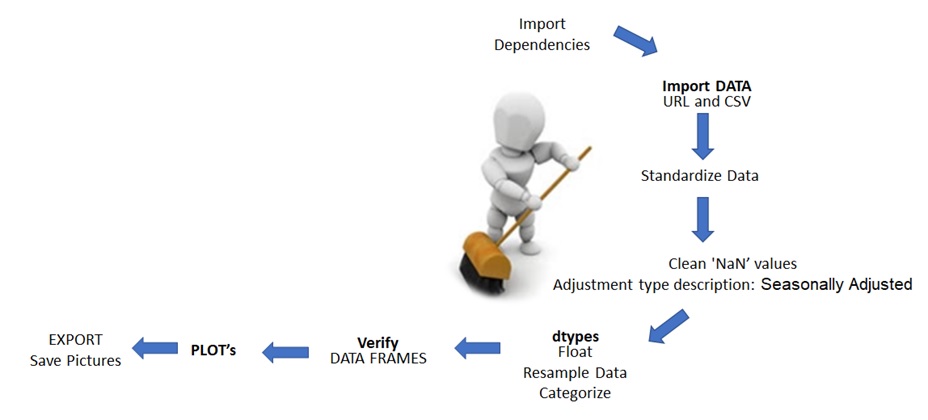
-CSV files imported into Pandas - the first challenge was organize the data in order to create the plots.
-CSV files imported into Pandas - the first challenge was encoding the CSV to account for accents and special characters in artist names.
-Columns renamed to align logically to tracks dataset.
-Removed pre-1980 track data to make a concise dataset.
-The dataframes were left-merged on artist name to import the followers and artist_id to allow artist_id to link the two datasets. Artists with no tracks listed were dropped.
-The new tracks & followers dataframe was then cleaned to drop any NaN values with the artist_id set as the index.
-A new artist dataframe was created using the cleaned data. --Duplicates removed and data ready to load into postgres.
-The followers column was dropped from the tracks database to remove any confusion between "artist followers" and "track popularity".