OUR MOTIVATION
We are curious to expand the JavaScript and DOM Manipulation previously performed in the course with UFO dataset from 2010.
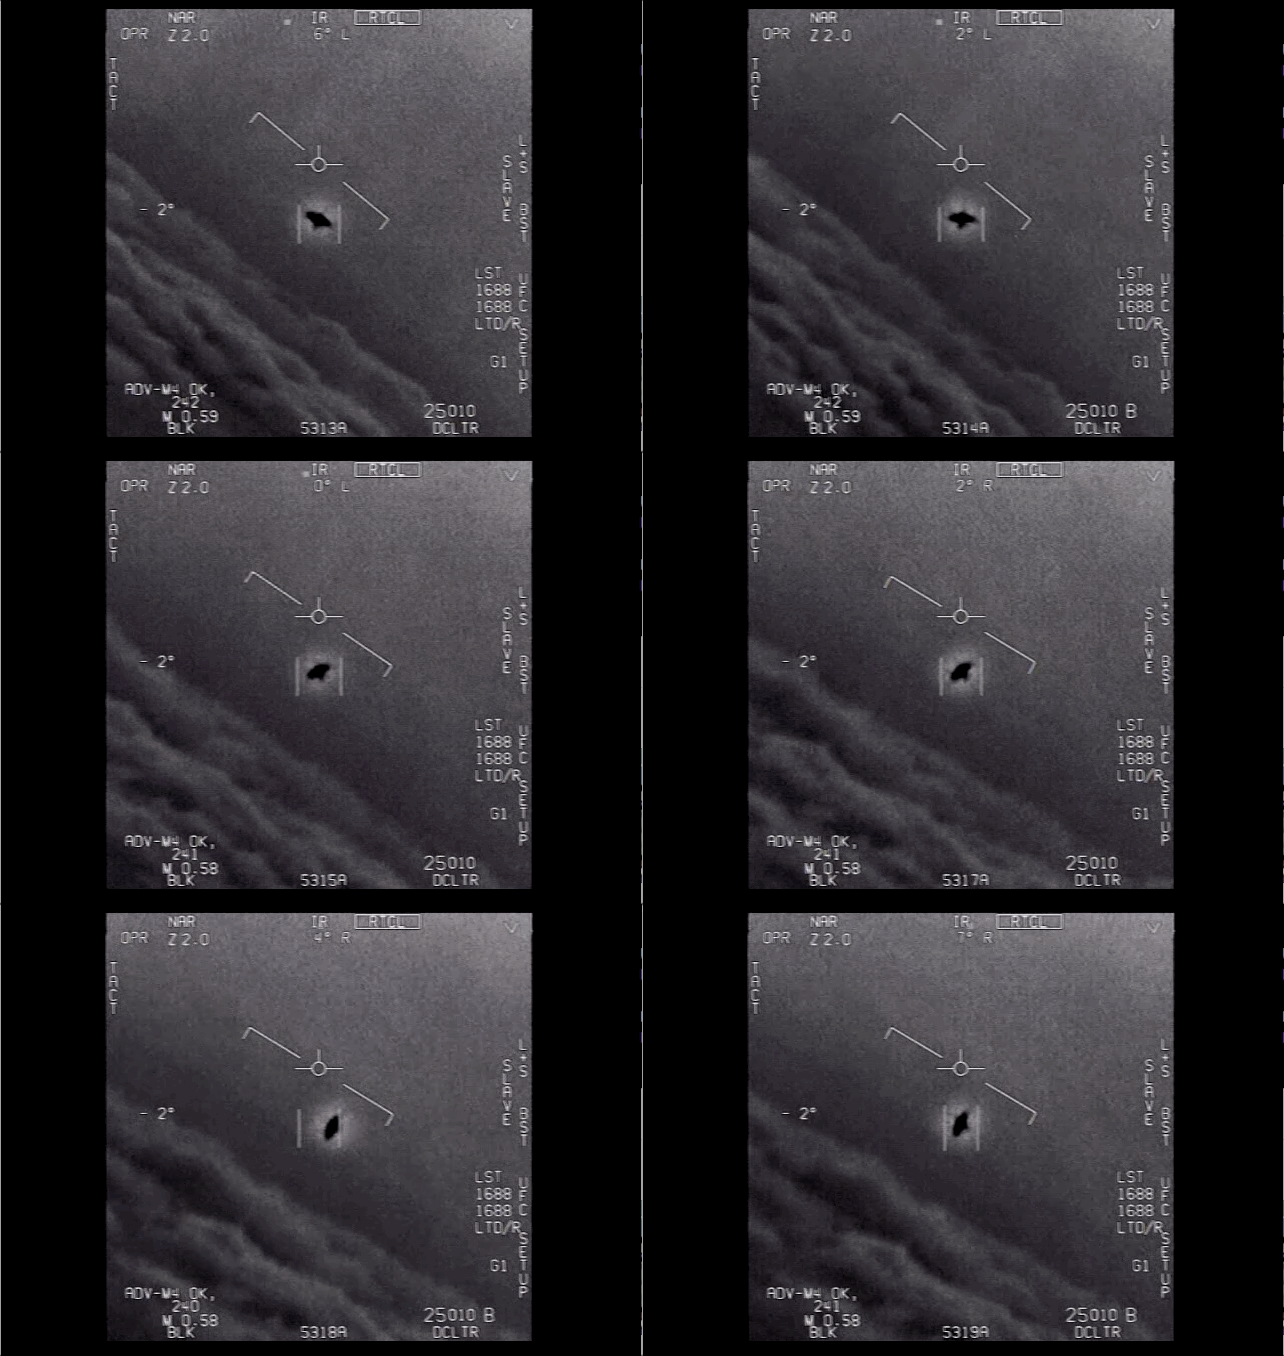
For as long as humans have existed there have been things in the sky.
Using Javascript-Leaflet library, We want create an interactive World Map that display a complete dataset of UFO sightings from past 10 years.
We are in 2021 and People still see things in the sky they can’t explain.
We feel interested to work with a NoSQL database. Mongo DB(Atlas) stores data in JSON-like documents. We believe this is the most natural way to store our dataset.
Ever wonder where is all of the data relating to UFO sightings are stored?
Worry no further, the data is here!
PROCESS
Initially we compiled datasets from data.world and Kaggle, but those datasets were incomplete, subsequently we performed Web Scrapping using a compiled and geocoded collection of UFO sightings from the National UFO Reporting Center (NUFORC). In addition, we used Geocoding API to complete some of missing latitude and longitude values.
ETL /NO SQL DATABSE
Using web scraping to complete our Dataset, We development an efficient ETL method for NoSQL to relational database(MONGODB ATLAS)
MONGOBD /FLASK APP
Using Python library (FLASK), We connect our the database and we defining objects and we Model relationships to extract our JSON File for Analysis
DATA INSIGHTS/PLOTS
We processed to look for data insights, doing Phython and R manipulations, we want represented our data using Leaflet, Plotly ,D3,etc.
OUTCOME/FRONT-END
We want to everyone to understand our process. The creation of friendly interface will be as selling point to future generations to expand analysis.
OVERVIEW
from flask_pymongo import PyMongo


BACK END / ABOUT US!
It was an absolute pleasure working as team, it was a tremendous effort, a lot of positive energy! Most of all for the opportunity to meet and hang out, it was only Online but we ’re hope we get more opportunities to work together again in the future face to face.
CONCLUSIONS
It’s pretty clear these sightings aren’t uniformly distributed, but is there a particular reason some areas are highly concentrated?.
-
Why should we use Flask for web development?
Flask helps you understand how each component from the back-end works to get a simple web application up and running. It was ideal for smaller projects like this one.
-
Heroku Mumbo Jumbo
Allows you to deploy this Python/ R web applications, without paying hosting, so that anyone with the link will be able to use it.
-
What is better D3.js or Plotly?
D3.js is an awesome JavaScript library, but it has a very steep learning curve. This makes the task of building a simple visualization more complex.
-
Forecasting model?
Time series model, to be explore ... we want to be able to predict the next ten year of UFO sightings, formulate your best estimation of the future this this data set.


